Teaching pie charts
How to help students do the calculations needed to construct a very familiar representation
23/06/2021
We see a pie chart somewhere—in a magazine, an online article or on television news—almost every day of our lives. And the message a pie chart sends can be clear and instantaneous. It’s a great way to get across how a set of data is distributed.
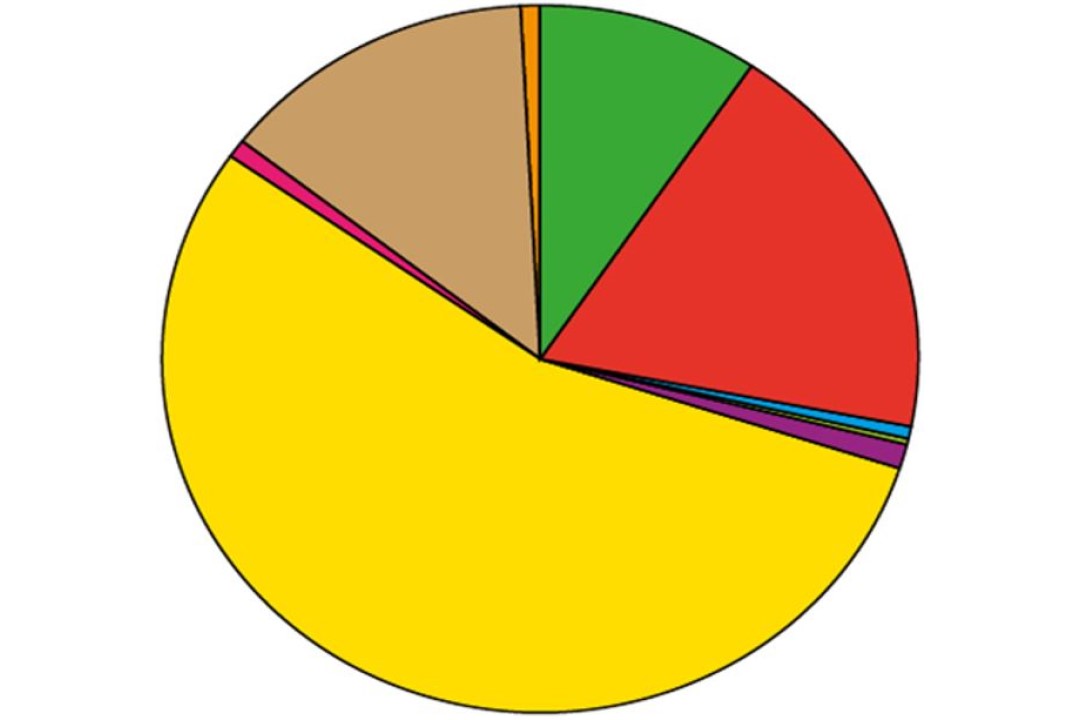
In this one, for example, it’s easy to see that whatever is represented by yellow is by far the most popular category. And orange and blue are way down the pecking order.
Most pupils, from Year 3 or 4 upwards, would easily be able to draw those conclusions.
But constructing a pie chart like that from a set of data is an altogether different prospect. It’s an example of a task that new or inexperienced teachers might think students—in Year 8 or 9, for example—could do easily. But, as older hands know, the reality is different.
The successful production of an accurate pie chart requires both accurate calculating and efficient handling of compasses and protractor. Neither of those can be taken for granted, but here we’re just going to concentrate on the number work.
What’s the angle?
The central task in constructing a pie chart, of course, is calculating the angle for each of the categories of data provided. So, let’s look at an example of a simple set of data and consider the potential pitfalls for students.
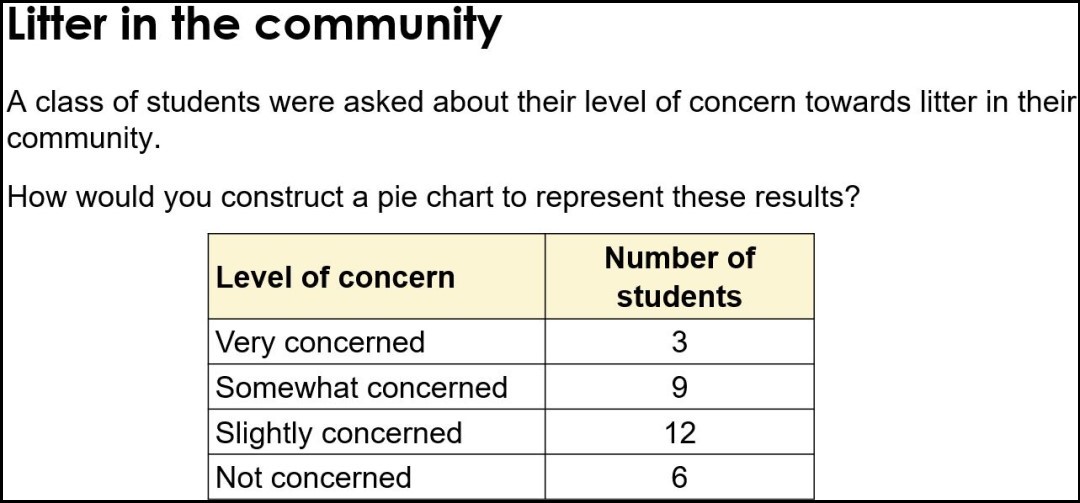
A teacher’s eye will quickly see that the numbers in the right-hand column add up to a (very helpful) factor of 360. Mental arithmetic does the rest, and the pie chart is constructed. But, for many students, none of this will come naturally. So planning for these difficulties is always advisable.
Questions and representations for a teacher to consider
1. Will all students immediately know that there will be four segments in the pie chart and that each segment will take up a proportion of 360 degrees? And that every one of those 360 degrees must be spoken for? If not, what questioning at the outset of a lesson will draw out that knowledge?
2. Will students know that adding up the total number of people is a very good first step. If not, what questioning might draw out that realisation in a way that it sticks as a generic first step?
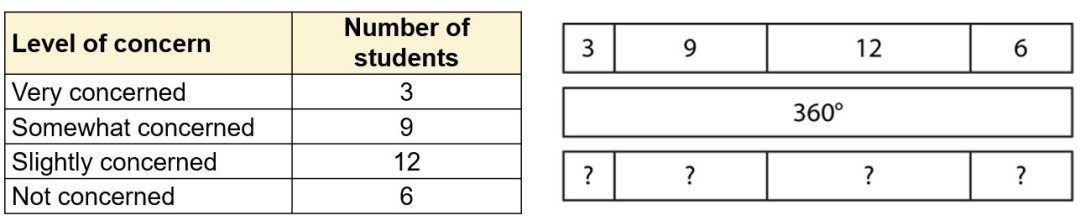
3. What representations might a teacher offer to help students visualise the calculations that they need to make? Here’s how a bar model might help:
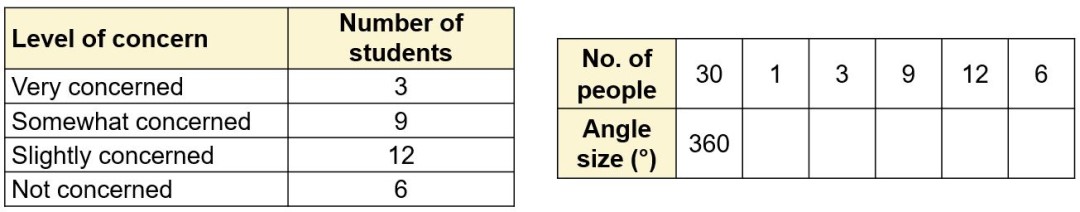
4. A teacher might also offer a ratio table to help students see how the numbers should be manipulated to calculate the angles. Notice how, in this table, the numbers 30 and 1 have appeared:
5. Here are some follow-up questions a teacher might use to probe the levels of understanding:
- ‘If 360° represents 30 people, what angle represents one person?’
- ‘If 30 people are represented by 360°, one person would be represented by __.’
- ‘If you know what angle one person represents, what else do you know?’
- ‘What do you need to multiply by to go from __ to __?’
- ‘If __ people are represented by __°, __ people would be represented by __.’
There’s nothing unique about how pie charts expose the phenomenon of scaling up and down in fixed proportions, or, put another way, how multiplicative reasoning rears its head in so many areas of maths. Similar triangles, percentage increases and decreases, enlargements and stratified sampling in surveys are just a few examples. It’s such a key skill for students acquire, to progress comfortably into KS4, that it’s worth taking time over in KS3.
Read around this topic
The images and examples are taken from Core Concept 5.1 of the NCETM’s Secondary Mastery Professional Development Materials.
Associated CPD
Non-specialist teachers can join a Maths Hub programme looking in depth at KS3 maths topics.